
![]()
![]()

The covidsymptom R package provides an easy way to import open data from the COVID Symptom Study-Sweden. The package includes five datasets:
national_estimates - daily estimated incidence of
symptomatic COVID-19 in Swedencounty_estimates - daily estimated incidence of
symptomatic COVID-19 in Swedish countiespostcode_estimates - daily estimated incidence of
symptomatic COVID-19 in smaller Swedish regions (2-digit postcodes)csss_tests - daily proportion of positive COVID-19
tests reported by CSSS userssymptoms - daily prevalences of symptoms reported by
CSSS usersOn 11 July 2022, we have completed the data collection phase of CSSS. We would like to thank our participants for their contribution to the research and our study since the start of the covid-19 pandemic. Without their data, it would not have been possible for us to follow the spread of infection in Sweden. We will continue to publish our results in scientific articles and at scientific meetings and we will share these results on the study’s website as soon as they have been reviewed and published. You can read more about the end of data collection here (Swedish). We are, therefore, working on the final version of this package for CRAN.
Install the CRAN version:
install_packages("covidsymptom")Development version of the package can be installed from Github with:
install.packages("remotes")
remotes::install_github("csss-resultat/covidsymptom")In order to respect CRAN best use practices, we will only push a new
version of the package with most recent data every one month. However,
data from COVID Symptom Study - Sweden is updated on a daily basis (see
end of data collection), thus the dev version of the package is also
updated daily. The function update_csss_data() (based on a
similar function from the
coronavirus
package), checks updates to the dataset and re-install the package
with the most recent data (dev version).
library(covidsymptom)
update_csss_data()
If you want to avoid updating the package to have the most recent
data, you can use the function get_latest_data() to import
the latest version available. Notice however that this won’t re-write
the package datasets.
library(covidsymptom)
national_estimates <- get_latest_data(data_level = "national")

head(national_estimates)
#> [1] "Your data is up-to-date"library(ggplot2)
library(dplyr)
covidsymptom::national_estimates %>%
ggplot(aes(x = Datum, y = Uppskattning)) +
geom_line(col = "#a60f61") +
geom_point(col = "#a60f61", size = 0.5) +
labs(x = "Date", y = "Predicted number of cases as % of the population",
title = "Predicted Number of COVID-19 Cases by Date",
subtitle = "") +
scale_y_continuous(limits = c(0, 1.3),
breaks = seq(0, 1, 0.2),
labels = paste0(format(seq(0, 1, 0.2), decimal.mark = ","), " %"), # add % sign to the labels
expand = c(0,0)) +
scale_x_date(date_breaks = "30 days", date_labels = "%d %b, %Y") + # can be "1 day", "2 days", etc.
theme_minimal() +
theme(axis.text.x = element_text(angle = 45, hjust = 1), panel.grid.minor.x = element_blank()) +
geom_ribbon(aes(ymin = Low_CI, ymax = High_CI), fill = "#a60f61", alpha = 0.09)
library(ggplot2)
library(dplyr)
library(lubridate)

counties_selection <- c("Skane", "Stockholm", "Vastra Gotaland", "Uppsala")

covidsymptom::county_estimates %>%
  filter(Lan %in% counties_selection) %>%
  ggplot(aes(x = Datum, y = Uppskattning, color = Lan)) +
      geom_line() +
      #geom_point(size = 0.5) +
      labs(x = "Datum", y = "Uppskattad förekomst", title = "% Uppskattad förekomst av symtomatisk covid-19", subtitle = "") +
      scale_x_date(date_breaks = "50 days") +
      theme_minimal() +
      theme(axis.text.x = element_text(angle = 45, hjust = 1), panel.grid.minor.x = element_blank(),
            legend.position = "none", plot.title = element_text(hjust = 0.5)) +
      geom_ribbon(aes(ymin = Low_CI, ymax = High_CI), color = "transparent", fill = "#a60f61", alpha = 0.09) +
facet_wrap(. ~ Lan) 
COVID Symptom Study - Sweden provides also predictions at 2-digit postcode levels.
library(ggplot2)
library(dplyr)
library(lubridate)
library(gt)

stockholm_codes <- c('11', '12', '13', '14', '15', '16', '17', '18', '19', '76')

filtered_data <- covidsymptom::postcode_estimates %>%
  filter(Postnummer %in% stockholm_codes & Datum == as.Date("2021-01-31") & !is.na(Uppskattning))

min_pred <- min(filtered_data$Uppskattning)
max_pred <- max(filtered_data$Uppskattning)
pred_palette <- scales::col_numeric(c("#f9dee2", "#5E0B21"), domain = c(min_pred, max_pred), alpha = 0.75)


filtered_data %>%
  arrange(desc(Uppskattning)) %>%
  gt(.) %>%
  tab_header(
    title = md("**Predicted number of cases as % of the population**"),
    subtitle = "Stockholm's 2-digit regions"
  ) %>%
  cols_width(starts_with("Datum") ~ px(95)) %>%
  tab_style(
    locations = cells_column_labels(columns = everything()),
    style     = list(
      cell_borders(sides = "bottom", weight = px(3)),
      cell_text(weight = "bold")
    )) %>%
  cols_align("center") %>%
  data_color(columns = vars(Uppskattning),
             colors = pred_palette) %>%
  tab_source_note(source_note = "Data: COVID Symptom Study Sweden") %>%
  tab_options(
    column_labels.border.top.width = px(3),
    data_row.padding = px(3),
    source_notes.font.size = 12,
    table.font.size = 12,
    heading.align = "center",
    row_group.background.color = "grey")
stockholm_codes <- c('11', '12', '13', '14', '15', '16', '17', '18', '19')

covidsymptom::postcode_estimates %>%
  filter(Postnummer %in% stockholm_codes) %>%
  ggplot(aes(x = Datum, y = Uppskattning, color = Postnummer)) +
  geom_line() +
  #geom_point(size = 0.5) +
  labs(x = "Datum", y = "Uppskattad förekomst", title = "% Uppskattad förekomst av symtomatisk covid-19", subtitle = "") +
  scale_x_date(date_breaks = "90 days") +
  theme_minimal() +
  theme(axis.text.x = element_text(angle = 45, hjust = 1), panel.grid.minor.x = element_blank(),
        legend.position = "none", plot.title = element_text(hjust = 0.5)) +
  geom_ribbon(aes(ymin = Low_CI, ymax = High_CI), color = "transparent", fill = "#a60f61", alpha = 0.09) +
facet_wrap(. ~ Postnummer, scales= "free") 
library(gganimate)
library(ggdark)

tests_df <- covidsymptom::csss_tests

a_plot <- ggplot(tests_df, aes(x=date, y=total_tests)) +
  geom_line() +
  geom_segment(aes(xend=max(date), yend = total_tests), linetype=2) +
  geom_point(size = 3) +
  geom_text(aes(x = max(date), label = sprintf("%2.0f", total_tests)), hjust=0, color = "grey") +
  transition_reveal(date) +
  view_follow(fixed_y = TRUE)+
  coord_cartesian(clip = 'off') +
  labs(title = 'Reported antigen tests in the Covid Symptom Study Sweden', y = 'N# Antigen tests', x = "Date") +
  enter_drift(x_mod = -1) + exit_drift(x_mod = 1) +
  dark_theme_gray() +
  theme(plot.margin = margin(5.5, 40, 5.5, 5.5))

animate(a_plot, fps = 5)
library(ggplot2)
library(dplyr)
library(ggrepel)

symptoms_df <- covidsymptom::symptoms %>%
  mutate(Vikt = factor(Vikt, levels = c("Positiv", "Negativ")))
symptoms_df[symptoms_df$Symptom == "Förlorat eller förändrat lukt-/smaksinne",]$Symptom <- "Förlorat eller förändrat\nlukt-/smaksinne"
data_ends <- symptoms_df %>%
  filter(Datum == max(Datum))

symptoms_df %>%
  ggplot(aes(x = Datum, y = Andel, color = Symptom)) +
  geom_line() +
  theme_light(base_size = 11) +
  labs(x = "Datum", y = "Andel deltagare med symptom", title = "Covid19 symptom", subtitle = "", color = "") +
  scale_x_date(date_breaks = "60 days", date_labels = "%d %b, %Y", limits = as.Date(c("2020-04-015","2022-07-01"))) +
  theme(axis.text.x = element_text(angle = 45, hjust = 1), panel.grid.minor.x = element_blank(),
        plot.title = element_text(hjust = 0.5, face="bold"), legend.position = "none",
        strip.text = element_text(face="bold")) +
 geom_label_repel(
   aes(label = Symptom, fill = Symptom), data = data_ends,
   fontface ="plain", color = "black", size = 3,
   xlim = as.Date(c("2022-03-20", "2022-07-01"))) +
facet_wrap(~Vikt, scales = "free_y", ncol =1) 
A supporting dashboard is available here
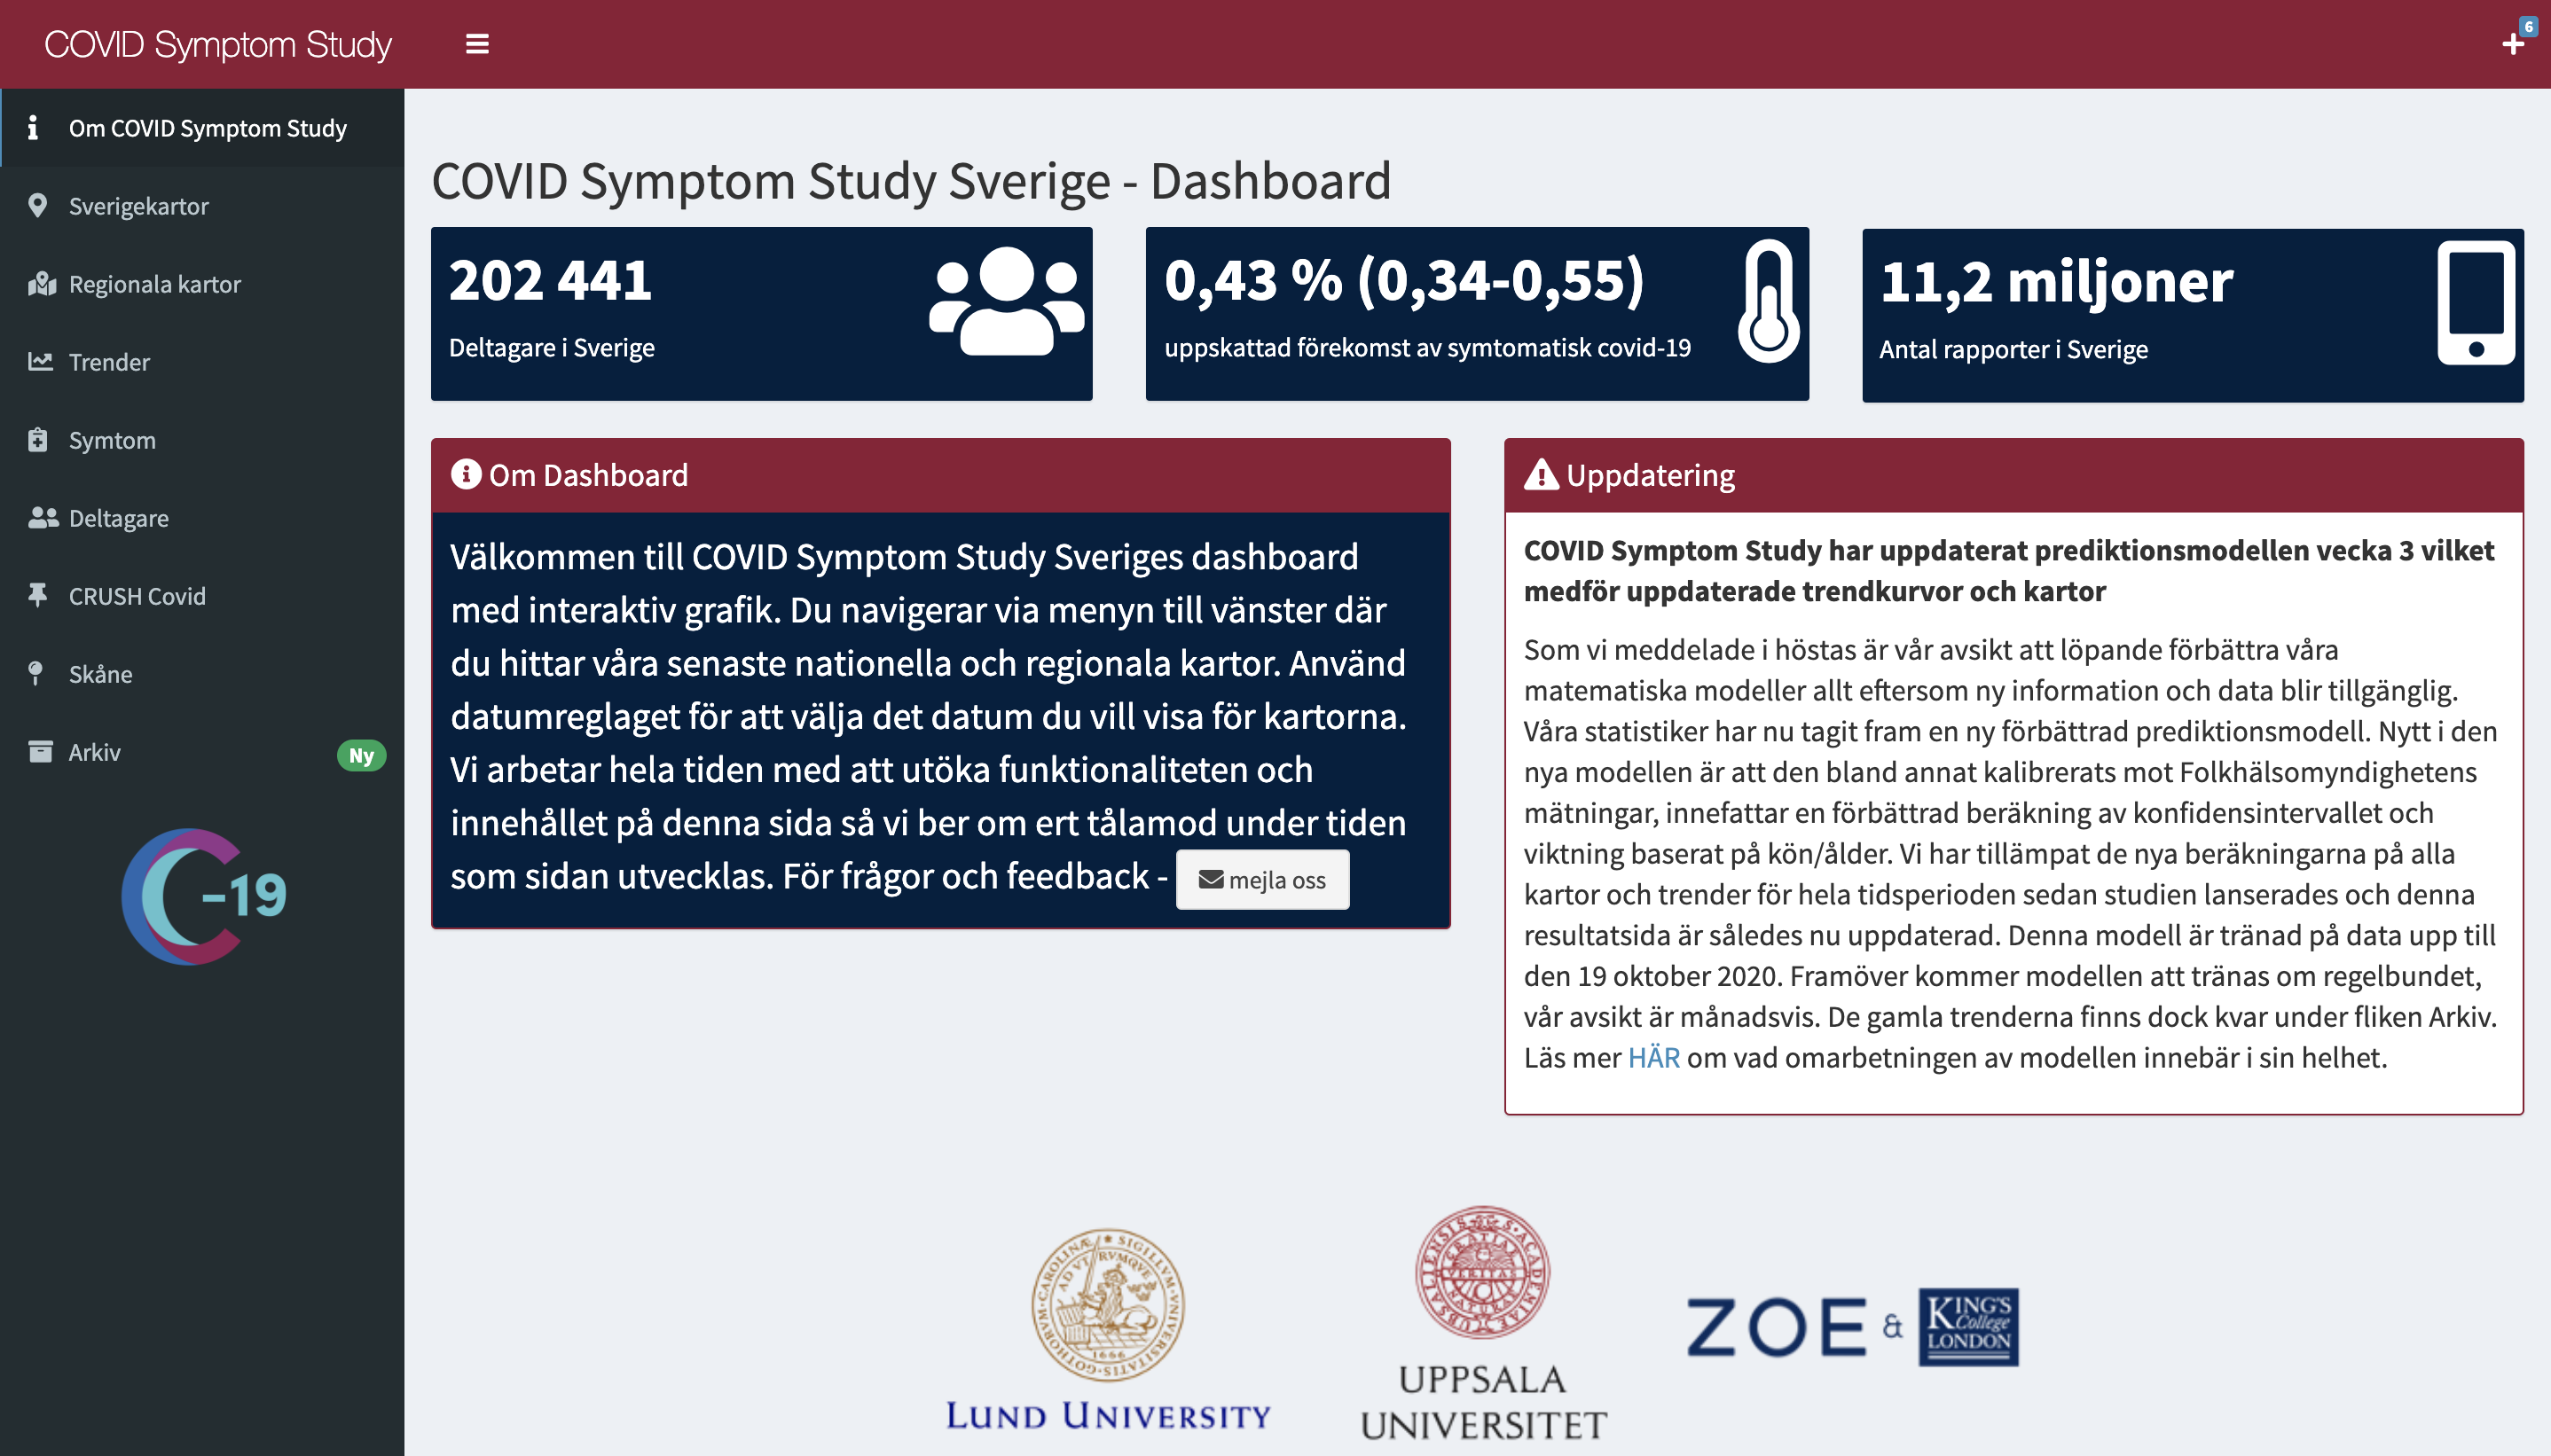
The COVID Symptom Study was a non-commercial project that used a free smartphone app to facilitate real-time data collection of symptoms, exposures, and risk factors related to COVID-19. The app was developed by researchers at King’s College and Guys and St Thomas’ Hospitals in London in partnership with health science company Zoe Global Ltd. Baseline data and recurring daily questions are described in Drew et al (Science, 2020). The app was launched in the UK and US March 2020. In Sweden, the study is based at Lund University and, as per a collaboration agreement on 28 July 2020, Uppsala University. More about the Swedish part of the study is described in Kennedy & Fitipaldi, et al. (Nat Comms, 2022) The app was launched in Sweden on April 29, 2020 as part of a national research initiative on COVID-19. >4.5 million participants in the three countries used the app, ~220,000 of whom live in Sweden. On July 11, 2022, with over 500 million data entries, in which Swedish participants contributed ~20 million of these, the project officially ended the data collection phase.