
The main method bayeswatch of this package fits an array
of Gaussian Graphical Mixture Models to groupings of homogeneous data in
time, called regimes, which we model as the observed states of a Markov
process with unknown transition probabilities. While the primary goal of
this model is to identify when there is a regime change, as this
indicates a significant change in input data distribution, an attractive
consequence of this approach is a rich collection of models fit to many
different possible regimes. A fault detection system that leverages
these model fits to describe the cause of a regime change is included in
detect_faults. For further technical details on these
methods, see the Citations section.
This repository is organized as a stand-alone R package. For questions, issues, or clarifications please reach out to Murph: murph290@gmail.com. Feel free to email any applications; we’d be happy to highlight them here.
You can install the latest version from CRAN using:
install.packages("bayesWatch")require(bayesWatch)Simulated data are available with a change-point imposed after day 5. This change-point only occurs for variables 3 and 4, with 4 seeing the more significant change.
data("full_data")
data("day_of_observations")
data("day_dts")

my_fit       = bayeswatch(full_data, day_of_observations, day_dts,
                            iterations = 500, g.prior = 1, linger_parameter = 20, n.cores=3,
                            wishart_df_inital = 3, hyperprior_b = 3, lambda = 5)
                            MCMC chain running...
# 5->10->15->20->25->30->35->40->45->50->55->60->65->70->75->80->85->90->95->100
# [1] "MCMC sampling complete.  Performing fault detection calculations..."

print(my_fit)
#      bayesWatch object
# ----------------------------------
#   Time-point Change-point probability
# 1          1              0.000000000
# 2          2              0.000000000
# 3          3              0.000000000
# 4          4              0.023904382
# 5          5              0.972111554
# 6          6              0.055776892
# 7          7              0.003984064
# 8          8              0.011952191
# 9 9 0.000000000plot(my_fit)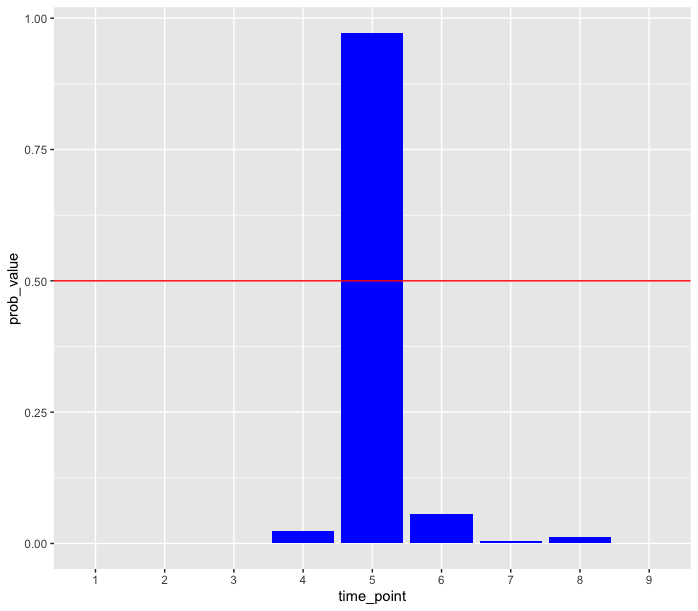
Once the regime vector is fit, we can print out the fault detection graphs.
detect_faults(my_fit)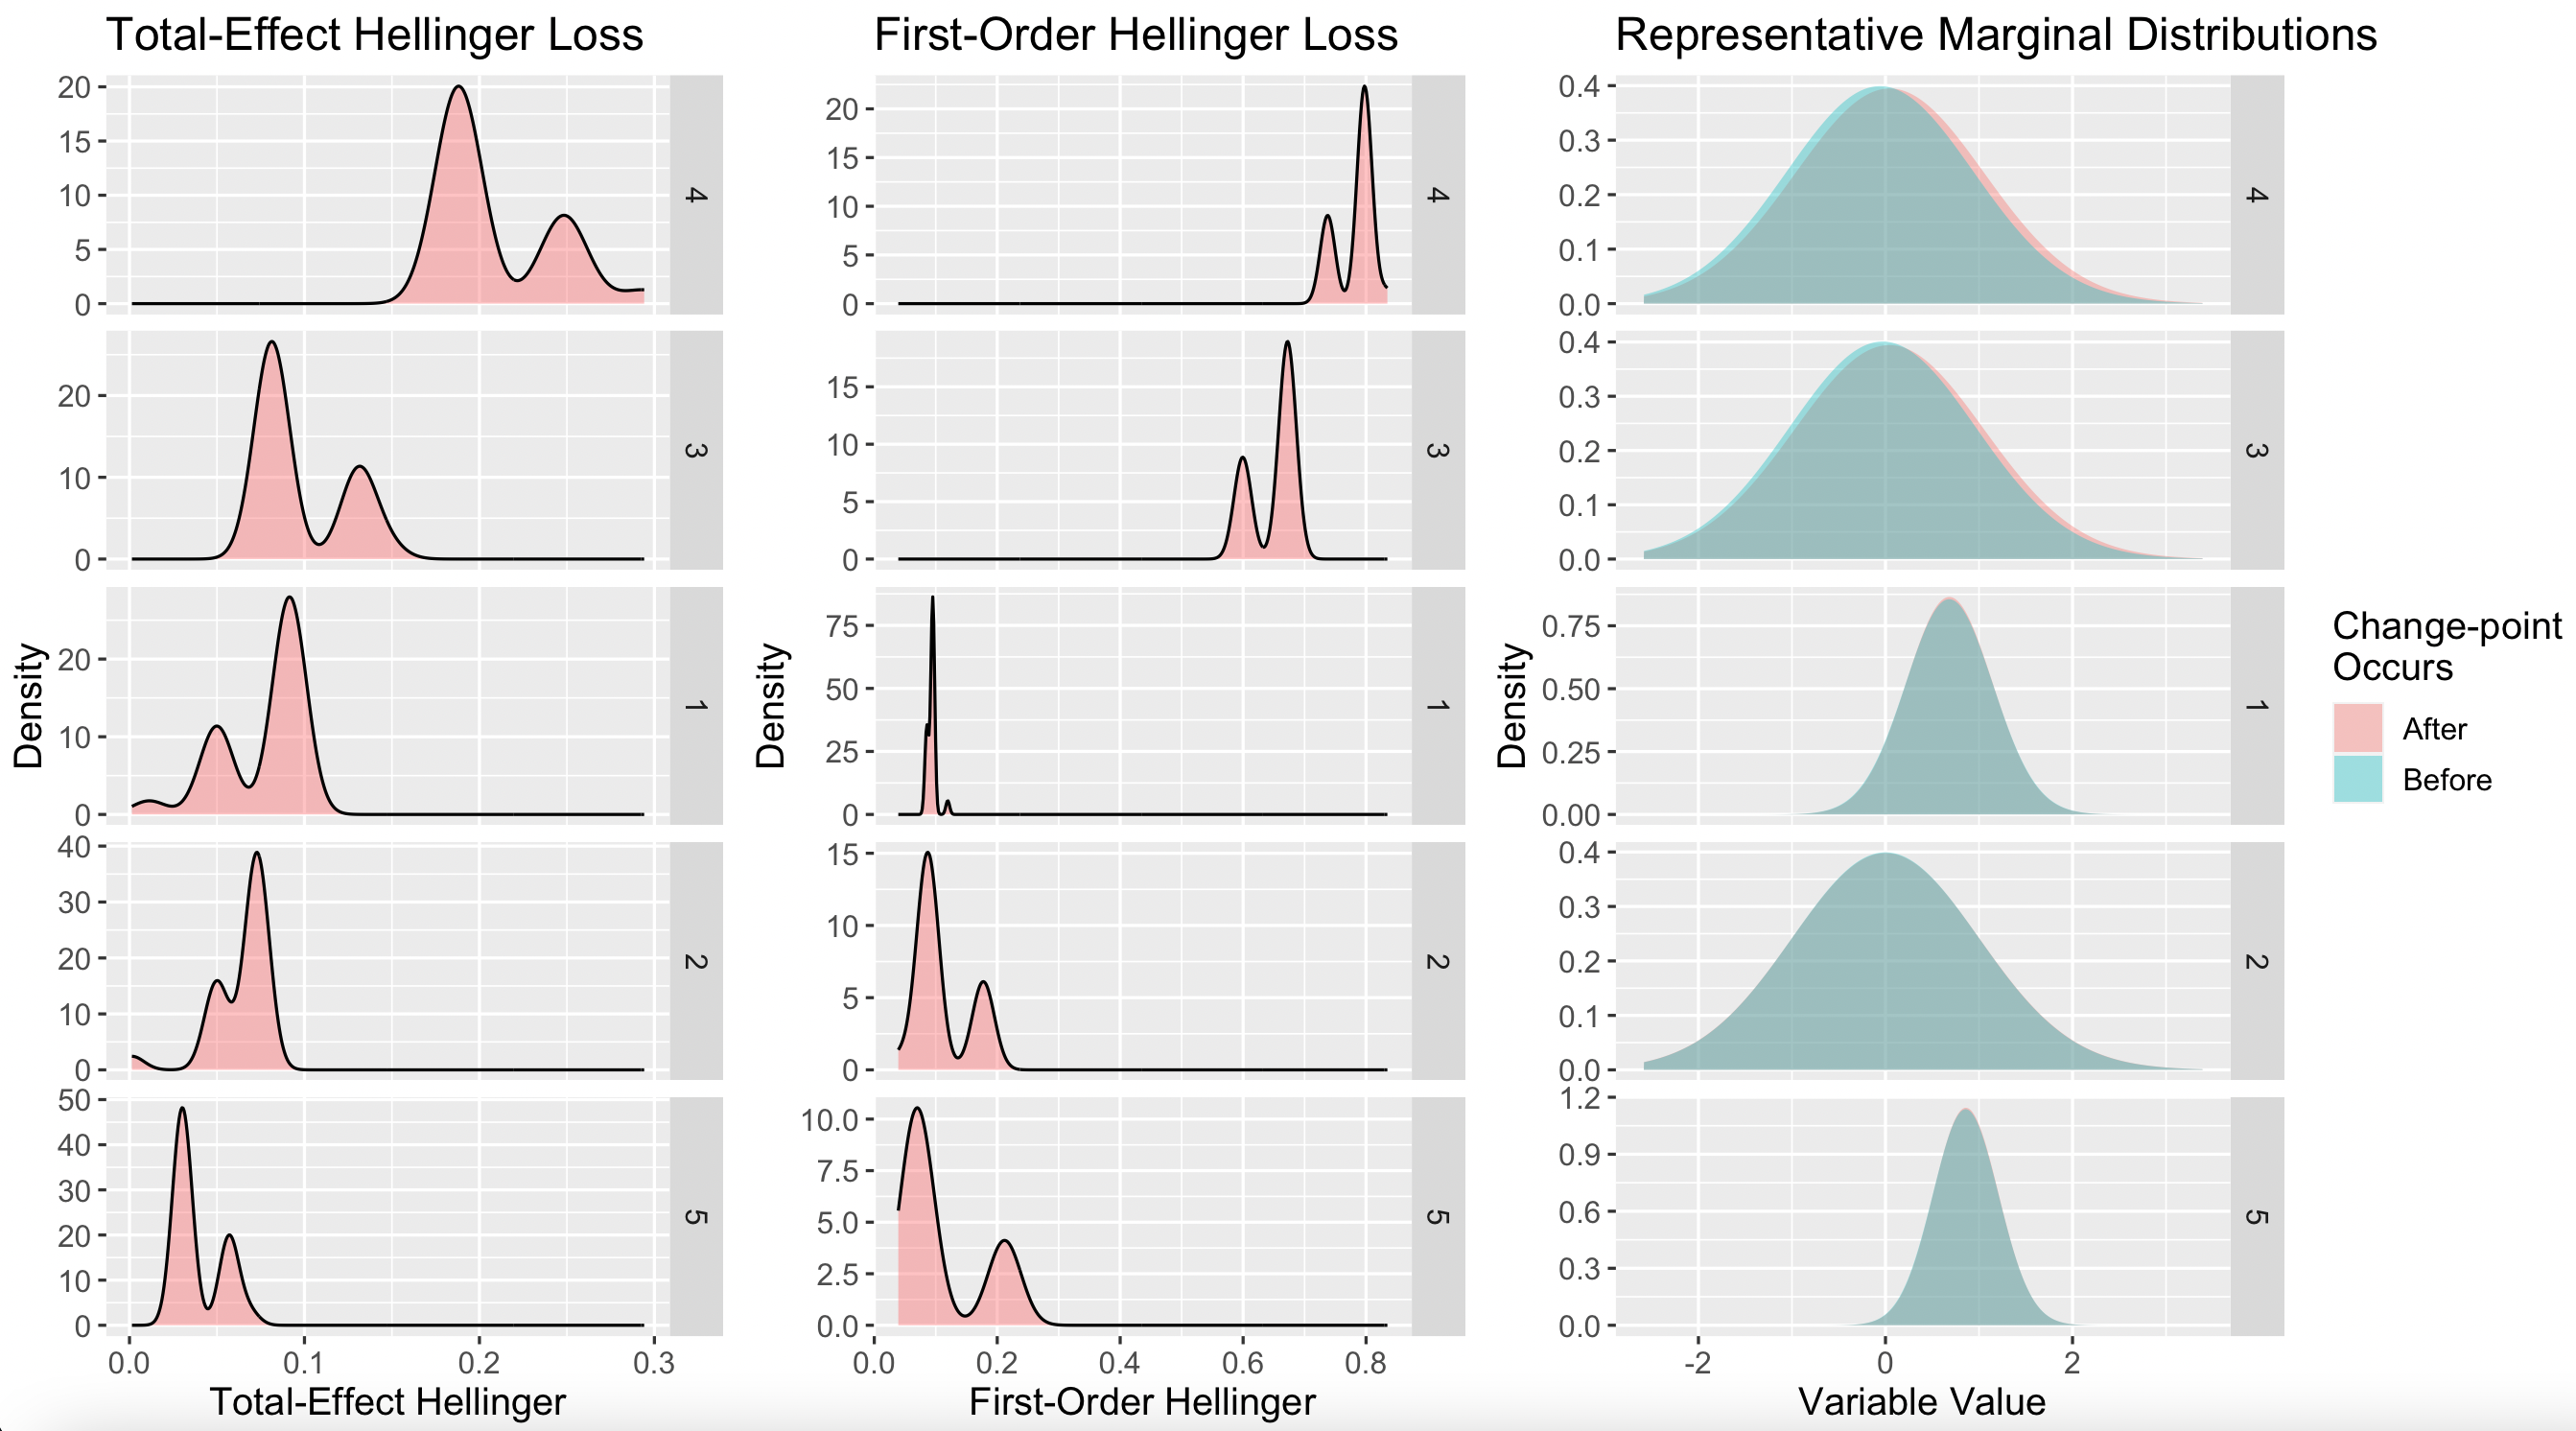
ggplot2, gridExtra, parallel, Rcpp, Matrix, CholWishart, Hotelling, MASS, ess, stats, methods, BDgraph
Alexander C. Murph, Curtis B. Storlie, Patrick M. Wilson, Jonathan P. Williams, & Jan Hannig. (2023). Bayes Watch: Bayesian Change-point Detection for Process Monitoring with Fault Detection.